Parameters
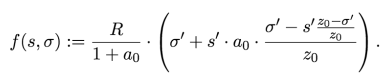
Formula break-down
o' [min(o,z0)] = ? (capped pool share)
s' [min(s,z0)] = ? (capped leader share)
B [s' * A] = ?
C [o' - B] = ?
D [C / z0] = ?
E [s' * a0 * D] = ?
F [o' + E] = ?
H [G * F] = ? (final result)
Explanation
Warning!
This demo-page is NOT a reward calculator!
You should NOT use this page to try and predict your staking profits!
The ONLY purpose of this demo is to show the effect of o, s,
and a0 parameters on the reward distribution process.
Cardano staking rewards distribution happens once at the end of each epoch (5 days).
For 5 days all the rewards in the system are collected in a special address.
At the end of an epoch total reward pool (R) is split between
all the participants and the treasury.
This formula is just a single part of the complex system, and it determines how
delegated pool stake (o) and personal pool-leader stake (s)
affect the reward distribution among pools.
Parameters description
"Desired number of pools" (k) - this is a system constant that is expected to
be around 100. This parameter shows what optimal number of pools is expected to be
in the system; at least 80% of total stake is expected to be controlled by this number of pools.
The stake share cap value (z0) is calculated from this parameter and this value
determines what is the maximum reward any single node can ever get. Basically,
if a node (pool) stake share is bigger then z0 - then it is calculated as
if its share was z0. The point of this is to make sure that system does not
settles at the number of pools lower than k - because if this happens,
then it would mean that people just miss additional possible profits that they can get
if someone creates new pools. There might and will be more than k pools,
but there shouldn't be less.
"Pool share" (o) - the share of all the stake in this pool, relative to
ALL the stake in the system. If the system has current total stake of 10 billion ADA,
and the pool has 50 million ADA of stake than it's share is 0.5% or
0.005. Maximum meaningful value of o is z0
which depends on k. So if the desired number of pools is 100, then maximum
meaningful o is 0.01 (1%). Any share, bigger than this, will
NOT bring more rewards. Pool share directly determines how likely the pool is to be
selected to produce a block for each slot in an epoch. The bigger the pool share - the more
slots it will win, and the larger total reward it will get. But it will NEVER
get more than z0 share of the total reward.
"Leader share" (s) - the share of stake that pool-leader (creator) has
pledged to this pool. Creator of the pool will need to "lock" at least
this amount of stake (or more) in order for pool to be selected at all. The size of this
pledge will also determine the overall size of pool rewards. Pledged stake is automatically
considered to be a part of the pool share, so if leader pledges 0.005 (0.5%)
of total stake, than the pool is already half-full, and there's only another 0.005
of "free stake space" left to be filled by delegation. Parameter s is
always <= than the parameter o. Maximum significant
value for the pledge is logically also z0, because if leader pledges z0
of stake - the pool is already automatically full, so no more stake can be delegated to it.
Only a pool with a maximum pledge will be able to receive the maximum delegation reward.
As pledge gets lower - reward also gets lower even for the same delegated stake share.
This pledge is required to eliminate the possibility for an adversary to create fake popular pools.
"Leader stake influence" (a0) - this is a system constant, and its value
is yet to be decided. The bigger this value gets - the harder it is for an adversary
to create enough pools to gain the majority control. BUT! At the same time the difference
in profits between differently funded pools also gets bigger.
"Total epoch reward" (R) - represents the pool of total reward for the whole epoch.
Similar pool of coins gets distributed among all the participant nodes at the end of each epoch.
Exact value of this parameter is not important for this demo and will affect only chart scales.
It is just randomly taken at 100 ADA so that charts would not look like promising some real numbers.
Sources
This formula is taken from the official reward scheme paper: Calculator Documentation
Pool stake to leader stake charts
Explanation
These two charts show how resulting pool reward is affected by changing
o and s values. You can try changing the a0
value and see how charts are changing.
Different s as o grows (left or top chart)
This chart shows how rewards for pools with different leader stake (s)
change as their delegated share (o) grows. You can see how rewards for
each pool logically goes up along with its share up until it hits the "cap" of (z0),
and after this even if pool gets more delegated stake - reward stays the same.
You can notice how all lines have different length. This is because you cannot have
parameter o to be less than parameter s. This is explained
by the fact that when a leader already puts 0.05 of total stake of personal stake
(s) into his pool - the total pool reward (o) is also
already equal to that number, which means that this pool is already "half-full",
and there's only another 0.05 of total stake available for delegates to "fill".
The most interesting property is how all lines are capped at different height.
This represents exactly the effect of leader stake on the pool rewards - the bigger
personal leader stake (s) a pool has - the bigger eventual reward it will
be able to get. You can see that the topmost line only starts at o=0.01
and is already capped - this means that the only way for a pool (or a node)
to get the maximum possible reward is to set the personal stake at the maximum possible
value. BUT! For a pool this would also mean that there's no "empty stake space" left
in there for others to delegate, because any further delegation will move such a pool
over capacity and will reduce profits for everyone.
Different o as s grows (right or bottom chart)
This chart shows the same data but from another angle. Each horizontal line here
shows the same data as corresponding vertical line on the first chart. So the top
line represents any "full" pool (o=0.01) this means that this pool has
reached its maximum capacity and will not be able to receive any more reward, even if
more people will delegate to it.
You can see top line representing how rewards would grow for a capped pool
as leader stake represents bigger and bigger share of it. The leftmost point
(s=0) means that there's no leader stake at all - the pool is capped,
but all the coins in it are delegated by other people. In the middle (s=0.05)
- half of stake is owned by the leader, and half of it is delegated by other people.
And in the right part (s=0.01) - all stake in the pool (node) is owned by
its leader and reward reaches possible maximum (z0).
Second from the top line represents a pool filled for 75%, it is shorter than the top
line, because it is impossible for a pool to have leader stake more than a total stake
at all (leader stake is regarded as a part of total stake), so chart would not work
that way. This pool will never be able to reach the maximum possible reward, just
because it doesn't have enough stake share at all. But you also can notice how this
line is a bit flatter than the top one, and the next one is even flatter. This shows
how delegated stake affects the total pool reward. Namely - it's something like it
adds value to the option of having leader stake. Meaning that if you own a "half-full"
pool (o=0.005) - then it is more profitable for the whole pool if you
would personally own half of coins in it (0.0025). But if you have a completely "full" pool
(o=0.01) - then the profit for the pool of you owning the same amount of coins
(0.0025) is even better now, and the whole pool would receive more reward.
Conclusions
The leader stake is important for a whole set of reasons, e.g. - it disincentivises whales to split their stake; it makes pools with a real locked stake more valuable than just empty pools that anyone can create, because former are less likely to brake any rules or be negligent; it also disincentivises whales from creating empty pools and putting their coins in there as delegates, instead of locking it in as leader pledge.
Interesting fact is that any pool in reality will never be able to receive the same share of rewards as its share of the stake is (cuz only maximum possible leader stake can guarantee maximum possible reward). This means that after each epoch there will be "left-over" reward. Do not worry, part of it will go toward the treasury, and the rest will be added to rewards for the next epoch.
Significance of a0
Both presented charts do not plot the a0 parameter. This means that you
can change its value in parameters form and see how it changes the charts.
Basically, this parameter determines - what will be the difference in rewards
between a full pool with no leader stake and a pool created with maximum leader stake.
As you move this value around - you can see how capped maximums on the left (top) chart
are either drawn together or drawn apart, and also how the top line on the right (bottom)
chart gets more and more steep or flat. This means that as a0 grows -
the profit from each single leader stake ADA is getting bigger and bigger.
And it gets bigger not because top pools are making more money, but because
bottom pools are making less. Which is obvious, because they can't have more than 100%
of total rewards to distribute.
Note! That detailed a0 plotting can be found on the next page with charts.
Leader stake influence charts
Explanation
These two charts show how resulting pool reward is affected by increasing the
a0 value with different o and s values.
You can change o or s parameters in the input form
and see how charts are changing.
Different o as a0 grows (left or top chart)
On this chart each line represents a stake pool of different stake share (o).
You can see how their rewards change as a0 parameter grows.
The leader stake (s) is not plotted, so you can change it's value in the
input form and see how it changes the chart.
You can see that the leftmost part of the chart (a0=0) is perfectly proportional
to the o value, for example, o=0.005 gets 50%
of rewards, and o=0.01 gets 100% of rewards, even if you change
the s value. This is because a0=0 means that leader stake
(s) has no effect at all and can be ignored. This is how one would expect
pool rewards to be distributed in a naive system.
But as a0 value grows to the right, you can see rewards getting lower
and lower, and the more stake a pool has - the more value it loses. So watching on this
chart you can estimate how having a pool of different saturation with no leader stake
will be affected by different values of a0.
Different s as a0 grows (right or bottom chart)
On this chart all lines represent pools with the same total stake (o)
(by default, they are all full, so o=0.01), but different leader stakes
(s). The pool stake is not plotted, so you can change this value (o)
in the input form and see how this chart changes.
You can see that in the leftmost part all pools have the same maximum reward of 1.0
(means 100%). This is because at a0=0 difference in leader stake plays no role.
But as a0 grows to the right, you can see how the pools with maximum
leader stake stay on the same position of maximum rewards, but pools with lower
leader stake shift down to lower and lower rewards. And you can see how the lower
leader stake a pool has - the greater downshift in rewards it gets.
Conclusions
These two charts demonstrate how majorly maximum rewards can be affected by increased
values of a0, an why it is important for stakeholders, which exactly value
will be selected by IOHK for the final implementation.
They also show how hard it is to chose the right value, because as a0
grows - security is improved, because it gets more and more costly for an adversary
to split stake (one of the main problems the leader stake is designed to solve). But at
the same time you get the problem that pools get worse and worse rewards as their
leader stake goes down, which results in the whole sector being largely dominated by
"whale pools", and anyone without a large pledge would not have a chance to build
a sustainable pool. At the same time, as a0 reduces - the environment
gets more and more "fair" and "flat", but at the same time a possible Sybyl attack
get cheaper ad cheaper to perform. So selecting the proper value for this parameter
is non-trivial, but very important task.
Note, that as you change value of s or o on the input form
you can notice some lines disappearing from the charts. This happens because o
can never be less than s, just because the personal stake of the
pool leader is included in the total pool stake. So it does not make any sense to
say "what is the reward at s=0.005 and o=0.0",
because this situation is impossible.